A Calm Approach to a Stressful Challenge
Production support often carries a reputation for being one of the most stressful and high-stakes responsibilities in software engineering. Whether it’s a critical outage or a subtle bug wreaking havoc behind the scenes, the experience can be overwhelming—especially for new developers. While some engineers appear to have a natural instinct for identifying issues quickly, the rest of us benefit from a structured approach that brings clarity under pressure.
Enter the Fishbone Diagram.
This simple yet powerful framework offers a visual and mental map for troubleshooting production issues. By categorizing the most common sources of failure, it helps teams cut through noise, combat analysis paralysis, and avoid wild goose chases. Most importantly, it gives newer engineers a repeatable process to follow, replacing anxiety with confidence.
Why Use a Fishbone Diagram?
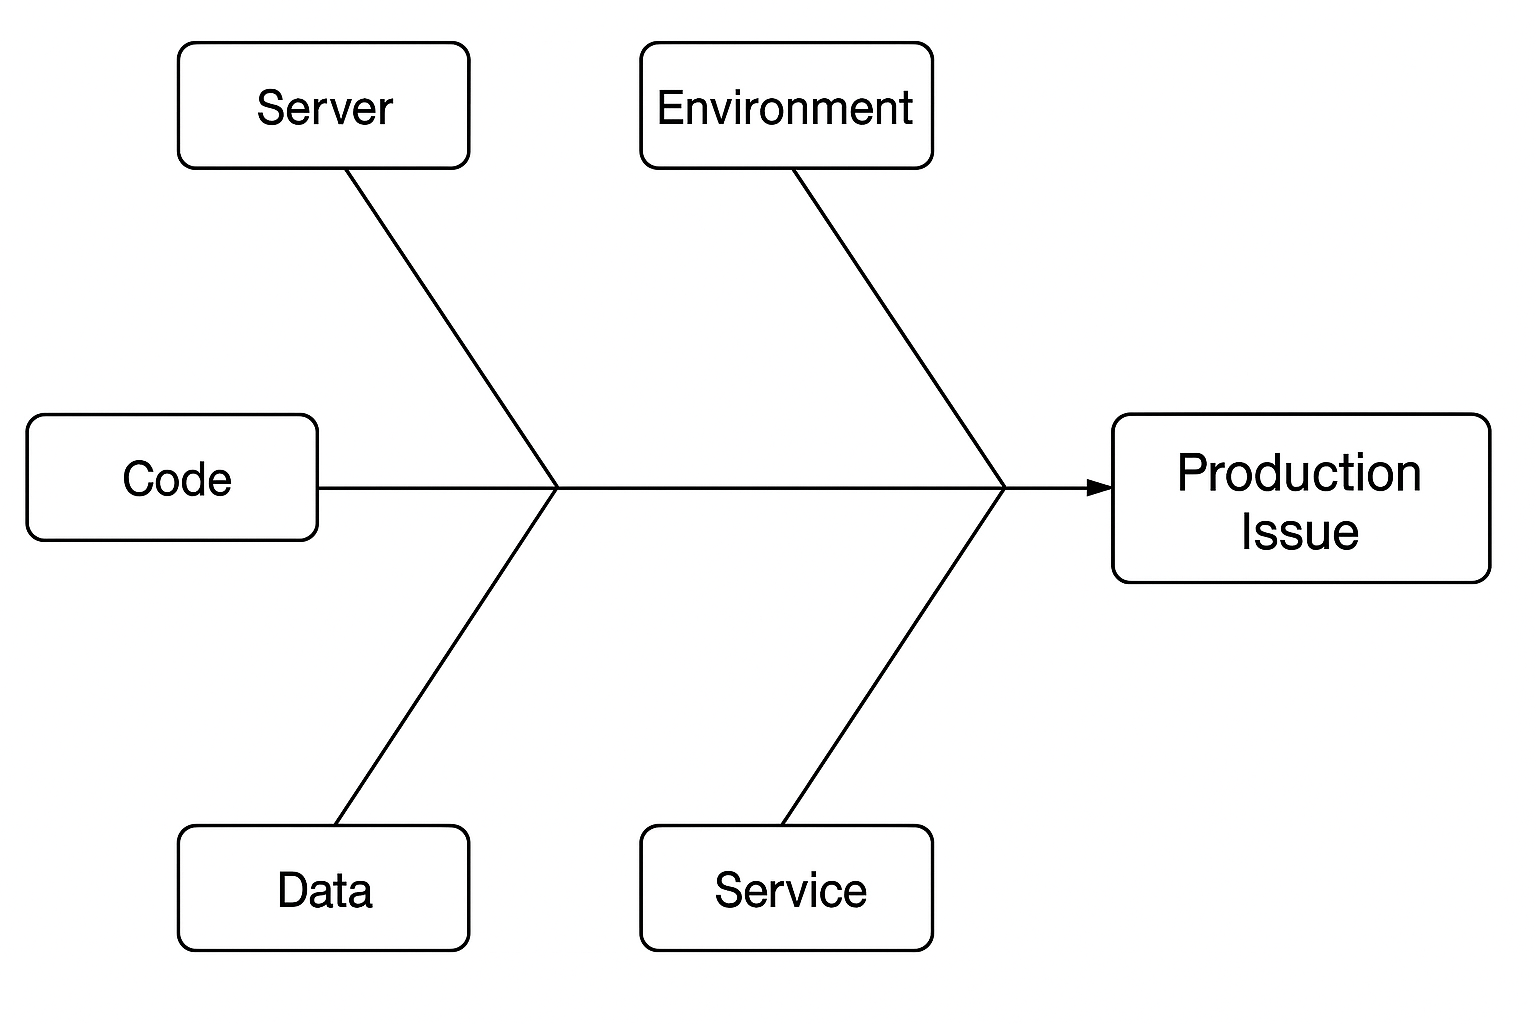
Every production incident is unique. However, over time, systems often develop consistent patterns around the causes of their failures. The Fishbone Diagram—also known as an Ishikawa or cause-and-effect diagram—encourages systematic thinking by identifying six core domains where problems most often originate:
- Server – Infrastructure issues such as memory exhaustion, CPU spikes, or unresponsive nodes.
- Environment – Problems related to deployment configs, secrets, version mismatches, or system variables.
- User – Misuse, incorrect input, or edge cases triggered by specific user behavior.
- Service – Failures in downstream APIs, dependencies, timeouts, or network reliability.
- Data – Corrupt records, unexpected schema changes, or problematic queries.
- Code – Bugs, logic errors, race conditions, or regressions from recent changes.
While the categories above are a useful starting point, the diagram can and should be tailored to each project’s unique context—especially in environments with specialized tech stacks or domains.
Putting It into Practice
The goal isn’t to fill in all parts of the diagram for every issue, but to use it as a diagnostic compass. When triaging a new problem, let the context guide you:
- If a bug appears shortly after a deployment, the Code domain is a likely suspect.
- If no code has changed but a new server was provisioned, start with the Server domain.
- If only one user is affected, investigate User input or Data.
- If multiple systems are failing at once, examine the Environment or Service domains for systemic causes.
These may seem like obvious conclusions in hindsight—but in the moment, under stress and assumptions, we often lose sight of this logical order. The Fishbone Diagram brings our reasoning back on track.
Supporting the Next Generation
For experienced developers, this model reinforces healthy troubleshooting habits. For junior engineers, it provides a safety net—a clear, methodical process they can rely on instead of feeling like they’re drowning in uncertainty. Over time, they’ll begin to notice patterns, develop their own instincts, and eventually become the calm in the storm for the next wave of developers.
Production issues will always carry pressure. But with a shared framework like the Fishbone Diagram, we can respond with clarity, empathy, and precision.
Appendix: Customizing Your Fishbone
Every project and team is different. Use the fishbone structure as a living document:
- Add or remove domains that reflect your system’s architecture.
- Track root cause trends from retrospectives to refine your diagram.
- Use it as a training artifact during onboarding.
By institutionalizing structured thinking, we make support not just survivable—but teachable, repeatable, and human.
Fishbone Diagram Example